
There has been a growing interest in the topic of peak oil theory for the past few decades. This interest has emerged after the 1956’s M.K. Hubbert peak oil theory was successful to forecast the peak year of crude oil production in the United States. Hubbert used a quantitative technique -Logistic Growth Curve or Bell-Shaped Curve (Fig.1)- to model the conventional crude oil production profile of the lower 48 states in the United States (excluding Alaska). He predicted that crude oil production would peak in the late 1960s or early 1970s. According to Heinberg (2003), many economists and oil companies dismissed his prediction at that time. However, when the United States’ oil production peaked in 1970 and consequently his theory proved correct, many authors used Hubbert Curve to forecast the oil production peak year in different countries.
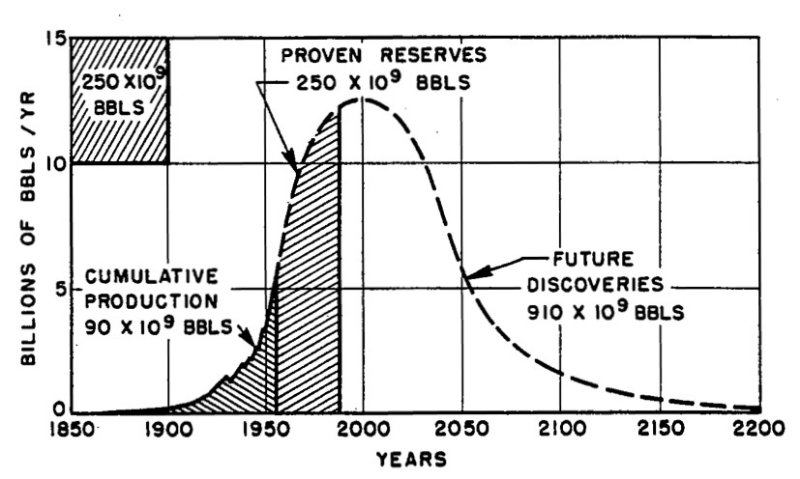
Fig.1. Hubbert’s 1956 prediction of world petroleum production rates (Hubbert,1956).
Although Hubbert peak theory garnered a lot of credibility after its success in predicting the peak of U.S. oil production, it started to fail after 1995 when the actual crude oil production decline rate was totally different from Hubbert’s prediction. Fig.2 shows the deviations of the actual crude oil production rate from what Hubbert predicted in his theory. The main reason for such discrepancy in the actual and predicted rate of crude oil production reduction according to Cambridge Energy Resource Associates (IHS CERA) (2007) is the fact that Hubbert did not consider the likely continuous resource growth, application of new and advanced technology, fundamental commercial factors, and the serious affects of geopolitics on production.
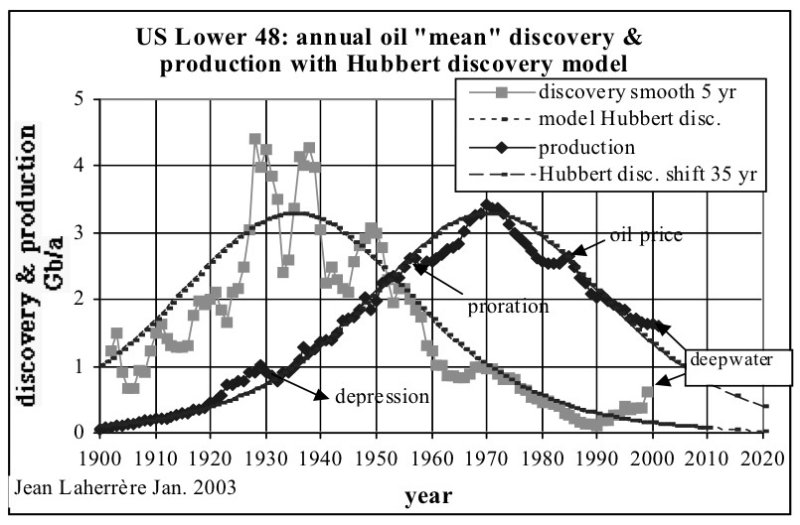
Fig.2. United States oil production excluding Alaska and Hubbert high estimate for the US (Laherrère, 2003).
II. CAUSES OF FAILURE:
1- Resource Growth
In his theory, Hubbert did not incorporate the continuous growth in resources. The methodology he used was based on imputing decline curves against currently proven reserves and assert that the game is over. According to Heinberg (2003), Hubbert used an estimated ultimate recoverable reserve ( EURR ) between 150 to 200 billion barrels of oil. Based on this value, he estimated the U.S. oil production to peak at 3 billion bbl/year ( 8.2 million bbl/day ) anytime between 1965 to 1972 as shown in Fig.3. Hubbert theory succeeded in predicting the peak time, but there were few deviations in the actual production rate form what he predicted.
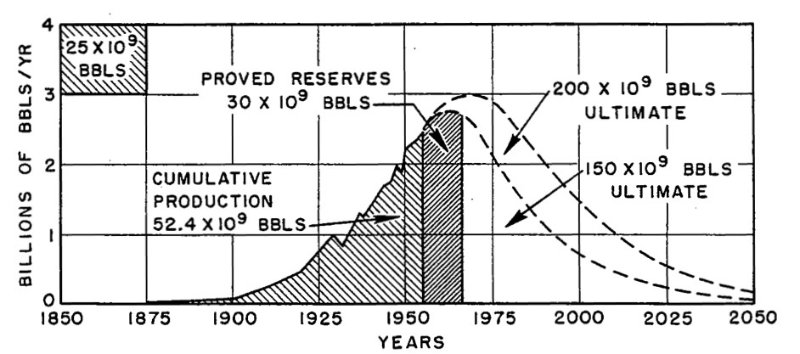
Fig.3. Hubbert’s Fig. 21 shows his 1956 forecast for USA oil production (Hubbert, 1956).
First of all, U.S. production rate peaked at 10 million bbl/day which was approximately 1.4 million bbl/day higher than what Hubbert predicted as shown in Fig.4. In addition, six years after peaking in November 1970, the U.S. production rate encountered its first deviation from Hubbert’s prediction. Oil production rose to 9.14 million bbl/day forming a secondary peak in the period between 1977 to 1986 as shown in Fig.4.
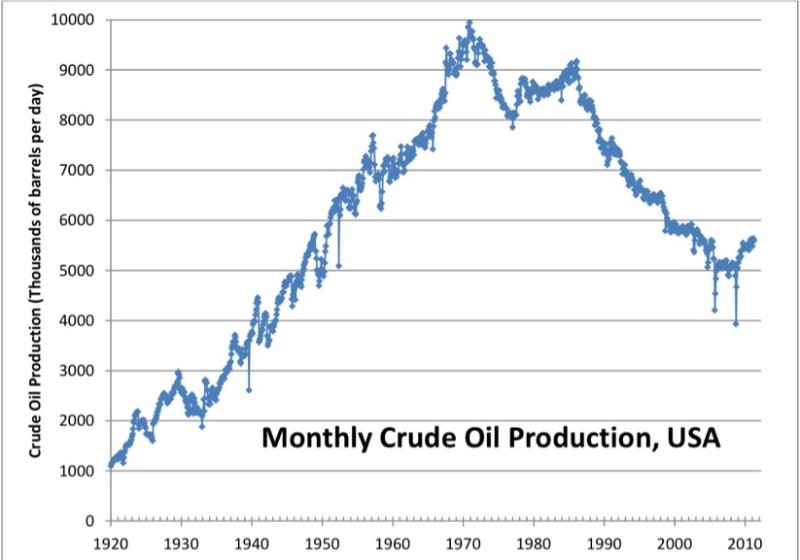
Fig. 4. Actual monthly USA oil production ( Data Source: EIA )
Furthermore, the second deviation from Hubbert’s prediction is the incline formed since late 2008 until the present time. In 2008, the U.S. produced five million bbl/day and just a year after that in 2009, U.S. production rate begun to rise until it averaged 8.3 million bbl/day in 2014.
Both deviations were due to new discovery and production of oil from the Prudhoe Bay, Kuparak oil fields in the north of Alaska and production from Gulf of Mexico along with unconventional crude oil coming from the Bakken oil play in North Dakota respectively. These deviations -rise in production- prove that the usefulness of Hubbert’s theory is limited because it requires a knowledge of totality of oil reserves in existence which is in a continuous growth leading to increase in production. Fig.5 shows the growth in the world oil reserves.
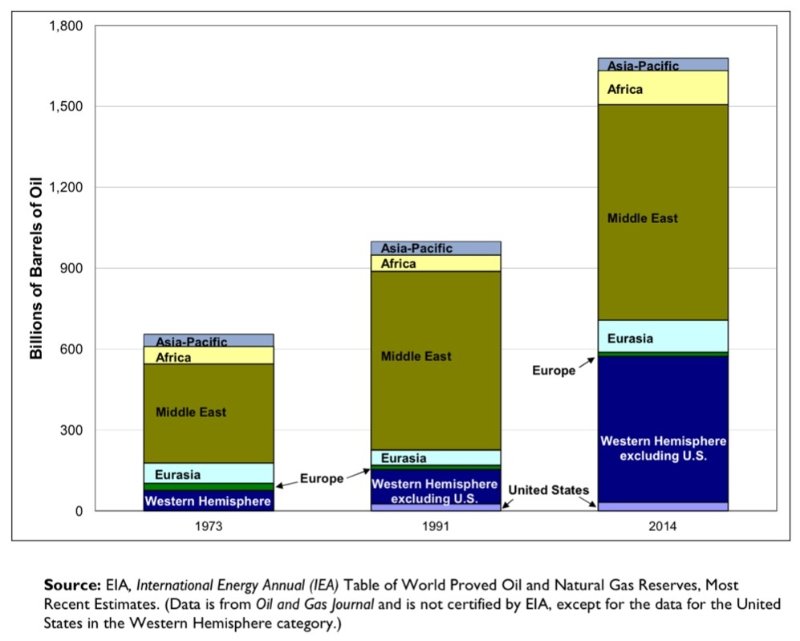
Fig. 5. World proved oil and gas reserves ( Data Source: EIA )
Although much of the easy oil -mostly located onshore and offshore in shallow water- was discovered and drilled, there are still many potential untapped reserves in different parts of the world. Therefore, predicting production peak and future trend without taking such resource growth into consideration leads to a misleading prediction.
2- Application of New and Advanced Technology
Similarly, Hubbert’s peak theory did not take into account the application of new and advanced technology that made the process of extracting oil cheaper and more efficient than it used to be. The application of such technology resulted in production increase. For instance, oil that 60 years ago may have been difficult and uneconomical to be extracted, could currently be recovered due to higher accuracy of surveys to locate the oil, advanced drilling technology and improved drilling methods.
Furthermore, the application of improved and new technology such as horizontal drilling and hydraulic fracturing have led to the production of shale oil in the United States and other countries that for years have been uneconomical to extract. This leap forward in oil-field technology -used for the drilling and extraction of once uneconomical to produce oil- is the main reason for rising the U.S. oil production rate in 2009. It clearly shows the critical role technology and innovation play in the increase of oil production which was not considered in Hubbert’s peak theory.
3- Economic Factors
Hubbert’s method failed to incorporate economic factors that directly influence productive capacity. The theory ignores the impact of two major drivers of production such as demand and price dynamics. It also fails to comprehend the economic factors that can direct the producing company and government national strategies to
control the production rate of crude oil. All these factors play a crucial role in determining the production rate of any country and the world in general.
4- Geopolitical Impact
Hubbert peak theory also did not take into consideration the impact of geopolitics on oil production. For instance, a major war in the most oil-rich part of the world -the Middle East- for example, would definitely skew the Hubbert’s peak theory’s graph dramatically changing the rate of production. This is also one of the examples of Hubbert’s peak theory failure to acknowledge the impact of external variables on oil production rate.
III. CONCLUSION
Despite the remarkable contribution, M. King Hubbert’s peak theory falls down because it did not incorporate the impact of resource growth, technology advancement and external variables such as geopolitical and economic events on production. The Hubbert’s model may work well under the assumption that everything else other than currently proven reserves remains equal, but of course in real life they never do. The restrictions we face today are more technological and economical than the amount of oil in the ground. We are limited by how inventive we are to find new resource and extract what is available.
REFERENCES
Heinberg, R. (2003). The Party’s Over. Oil, War and the Fate of Industrial Societies. New Society Publishers, Canada, 275 p.
Hubbert. M.K. (1956). Nuclear Energy and Fossil Fuels. Shell Development Company, Exploration and Production Research Division, Publication Number 95, 22 p.
IHS CERA, 2007. “Why the Peak Oil Theory Falls Down: Myths Legends, and the Future of Oil Resources”.
Laherrere, J.H. (1994). Published figures and political reserves. World Oil.